Aussie Industries With an Advantage (Part 2): Mining and Energy as a Sample
What industries can Australian and New Zealand companies list and survive in?
This is the next installment in a multi-post research project looking at the industries with a natural advantage for companies in Australia and New Zealand.
Last week we outlined the research methodology, the industry data set we will use (ANSIC) and the industry attributes we think matter.
Today’s post is about doing a data collection test for a small sample of industry domains to test our method before we analyse all the industry domains.
Industry Attributes That Matter
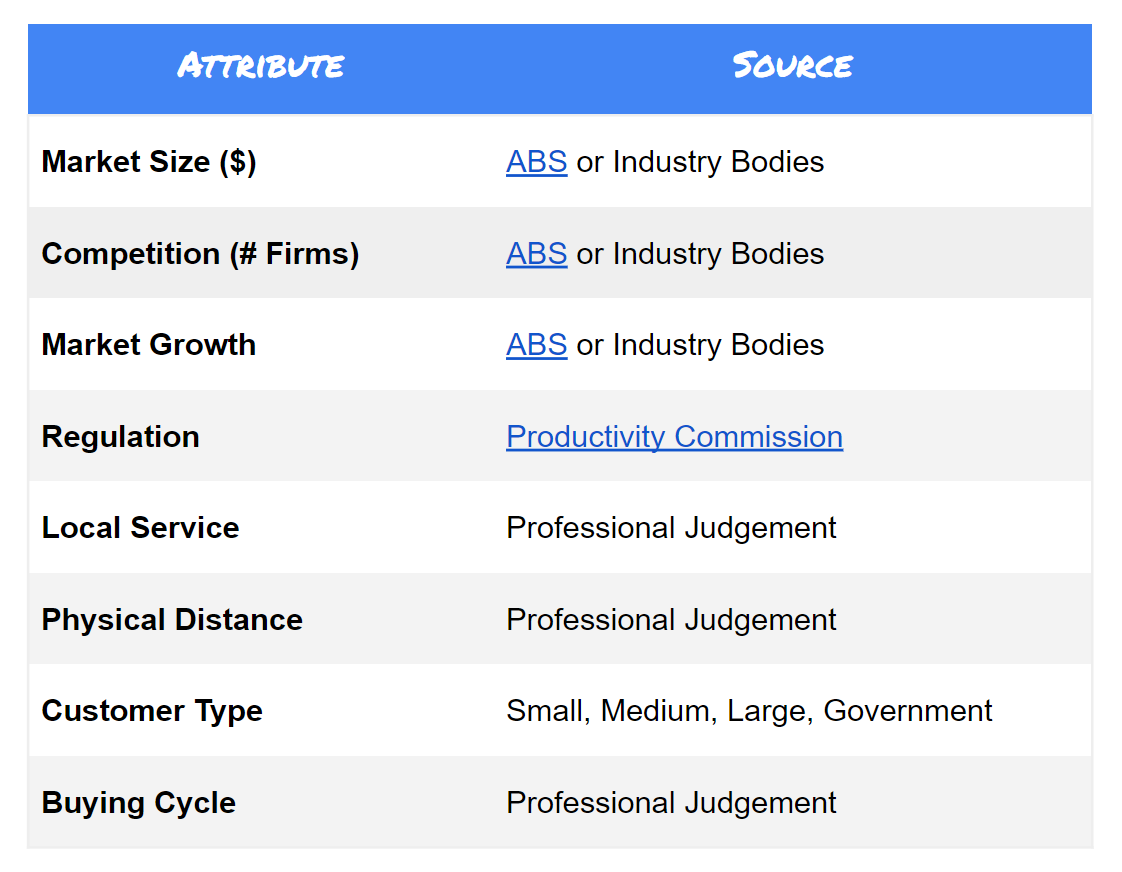
For reference, the industry attributes we initially set out to look at are in the table below:
As you’ll see later, our data collection test has already meant an update to the industry attributes we will collect and analyse in future.
Data Collection Test
For the Data Collection Test, we selected a small sample of two industries (Mining and Energy & Utilities) to make sure that the data we’re collecting and the way we are collecting it will scale and provide the insights we want.
This means that before we do an exhaustive analysis of every industry domain we can get a sense of what might need to change in our methodology, data collection approach or industry attributes considered.
Industry Financials
We need to collect financial information on the industries. This financial information, like market size and growth, was straightforward to collect from the Australian Bureau of Statistics (ABS).
The ABS data doesn’t get down to the finest grain industry domain available but, if we can get the “subdivision” industry code. We can at least use this for an initial filter of which industry subdivisions might be more or less interesting.
It was relatively straightforward to build the following from ABS data:
Other Industry Attributes
Once we moved onto the fields that required professional judgement it became more difficult.
Regulation was challenging because we could not find quantitative data points that could be comparable across industries.
We were hopeful we might find measures like “there are 389 regulations that are specific to the Coal Mining industry subdivision” or “the cost of regulation to this industry is $5bn.”
The Productivity Commission and Prime Minister’s Office have both released different reports and guidance, including guidance on Measuring the Cost of Regulation. However, we were still unable to find a quantifiable measure for a single industry or across industries.
So we needed to shift Regulation to a professional judgement based on analysing Productivity Commission reports, relevant legislation, and relevant industry association reports. This will then inform categorising an industry’s regulatory burden as Light, Moderate, or Heavy.
Local Service, Physical Distance, Customer Type, and Buying Cycle were determined based on experience and understanding of the industries rather than any specific analysis. We’ll probably need to re-evaluate this and provide a stronger framework for making the determination in the future but, for now, we want to consider what insights we can gain.
Initial Insights
In doing this Data Collection Test a few insights start to emerge:
Waste Collection looks, in relative terms, highly competitive with low growth, a high number of firms, and low profit margins.
Gas, Water Supply, Coal Mining, as well as Oil and Gas Extraction all have a low number of firms. But, Gas and Water Supply, with lower profits and lower growth, seems likely to be less dynamic relative to the Mining subdivisions.
These broadly match our subjective understanding but will be worth analysing further in the future. It’s this next step - of taking this high level industry comparison - a step further that we will do in the next part of this research.
We want to see what, if anything, makes any of these industries and the companies in these industries have a more natural advantage by being in Australia. Then, we want to see if we can relate this back to the Industry Attributes.


