
Durability of ASX Tech and AI Moats
40% of ASX Tech Has No Moat Against AI. But 20 Have Plenty.

A handful of ASX tech companies have high durability in the face of AI, while most are on shaky ground.
I evaluated 201 ASX-listed tech companies for their durability in the face of AI.
I used a framework proposed by legendary venture capitalist, Gokul Rajaram, that describes 8 Moats technology companies need if they want to survive and thrive in the age of AI. I like to call it the “8 AI Moats” for short.
The small number of companies with strong moats and therefore durability have multiple moats stacked together. Unsurprisingly, these are mostly the companies with the biggest market caps.
Most companies fall at the other end of the spectrum, relying on a relatively weak workflow moat. The moat most at risk of being bulldozed by AI.
This second article in my series on AI and ASX Tech looks at the AI moats of listed companies. It lays out the 8 AI Moats Framework, shows how companies were scored, and explores some of the insights from scoring the 201 companies.
Whether you are an investor, founder or technology executive, it will hopefully help you compare against the rest of the market.
The contents of this article are:
1. The 8 AI Moats Framework
2. How Companies Were Scored: A Selected Sample
3. Frequency of Moats on the ASX
4. Six Durability Archetypes
5. The Moat Barbell Curve
6. Key Insights the 8 AI Moats Give for ASX Tech
The 8 AI Moats Framework
The 8 AI Moats Framework is the best framework I’ve come across for thinking about the durability of technology companies in the face of AI.
I came across the 8 AI Moats while listening to venture capitalist Gokul Rajaram. Gokul is on the front line of wrestling with AI through his venture investments in companies like Airtable, Vercel and Figma. On top of that, Gokul faced strategic challenges directly as a technology executive at Google, Facebook and Block. Gokul’s background, my own experience and some thoughtful consideration are why I’ve adopted this framework for this analysis and in my own businesses.
The 8 AI Moats
The 8 AI Moats, in no particular order, are:
• Data: Proprietary, hard-to-replicate data accumulated through normal operations. Not third-party data the company licences.
• Workflow: How embedded the product is in the customer’s day-to-day. Switching is painful or risky.
• Regulatory: Licences, clearances, accreditations or compliance regimes a competitor would need to replicate.
• Distribution: Owned or privileged paths to the customer that a competitor can’t easily duplicate.
• Ecosystem: Third-party developers, integrations, or partners that depend on the platform.
• Network: Each new user makes the product more valuable to other users.
• Physical: Hardware, infrastructure, or physical inventory required to deliver the product.
• Scale: Cost or feature advantage that compounds with size.
You can see that while it shares similarities with a comprehensive and rigorously researched strategic framework like the 7 Powers by Helmer, it isn’t a replacement for it. The 8 AI Moats is more specifically targeted at technology companies and thinking about the AI challenge (and opportunity).
Scoring and Methodology
To score the listed companies each AI Moat was converted to a scale of:
· 0 (not present),
· 1 (weak / emerging),
· 2 (moderate, meaningful but not dominant),
· 3 (strong / entrenched).
For each AI Moat we developed some guidance around what each score on the scale looked like to make sure we had some consistency.
Then I had Claude run through all the companies and score each of them. In reviewing the research, most scores were sensible, so I left them as is for consistency rather than reviewing and rescoring each company in detail. There are some specific moats that you or I might score slightly differently, but directionally, the AI-driven research produced a sensible result.
How Companies Were Scored: A Selected Sample
To show how the moats were scored, a table of a sample of recognisable companies is shown below. The selected companies are spread across B2B SaaS, marketplaces, HealthTech, consumer, hardware, and data centre infrastructure.
 across eight dimensions for twelve well-known ASX tech companies.")
Figure 1: Moat fingerprints for twelve recognisable ASX tech companies. Source: Terem Capital moat scoring, April 2026.
A few things are worth drawing out.
WiseTech, Xero and Pro Medicus all land in the top tier with slightly different shapes. WTC is the most complete profile in the dataset, scoring 3 on every dimension except physical. XRO stacks data, workflow, ecosystem, network and scale but has no meaningful physical moat. PME combines data, workflow, regulatory and distribution at the top of the scale, with softer network and ecosystem profiles. Three of the most admired ASX tech businesses and three genuinely different moat architectures.
The marketplaces are data-heavy, not just network-heavy. SEEK and CAR both score 3 on the network moat, which tracks intuitively. Less intuitively, they also score 3 on data and on distribution. The decades of candidate behaviour data SEEK holds, and the vehicle pricing data CAR holds, are moat ingredients that outlast any single marketplace mechanic. The fingerprint makes that visible in a way a one-line “marketplace” label doesn’t.
NEXTDC is the inverse of a typical SaaS profile. No data moat at all, workflow only moderate, no regulatory lock-in. But 3s across distribution, ecosystem, network, physical and scale. The moat is the building, the fibre, the interconnect and the cross-connect ecosystem. This is a useful calibration of the framework: “no data moat” can sit alongside “genuinely hard to displace” without contradiction.
Codan is the only company that scores 2 or above on all eight dimensions. Not WiseTech. Not Xero. CDA is a hardware company that sells into defence, mining and security markets — businesses that combine proprietary data, certified hardware, regulated channels, a global distribution network, and a partner ecosystem. It is a useful reminder that the “full-stack moat” company is rare, and when it shows up it doesn’t always wear the usual SaaS uniform.
HUB24, PEXA and Computershare illustrate the workflow-plus pattern. Each has a workflow moat score at 3, plus reinforcing moats in regulatory, distribution or scale. Each one sits inside financial infrastructure (wealth platforms, property settlement, corporate registry) where workflows are strangled by compliance, and where replacing the incumbent costs years and regulatory approval. This is where workflow-lock-in is at its most AI-resistant.
Frequency of Moats on the ASX
The chart below, Figure 2, shows how often each moat appears. This tells us how common or rare moats are across the ASX’s tech companies.
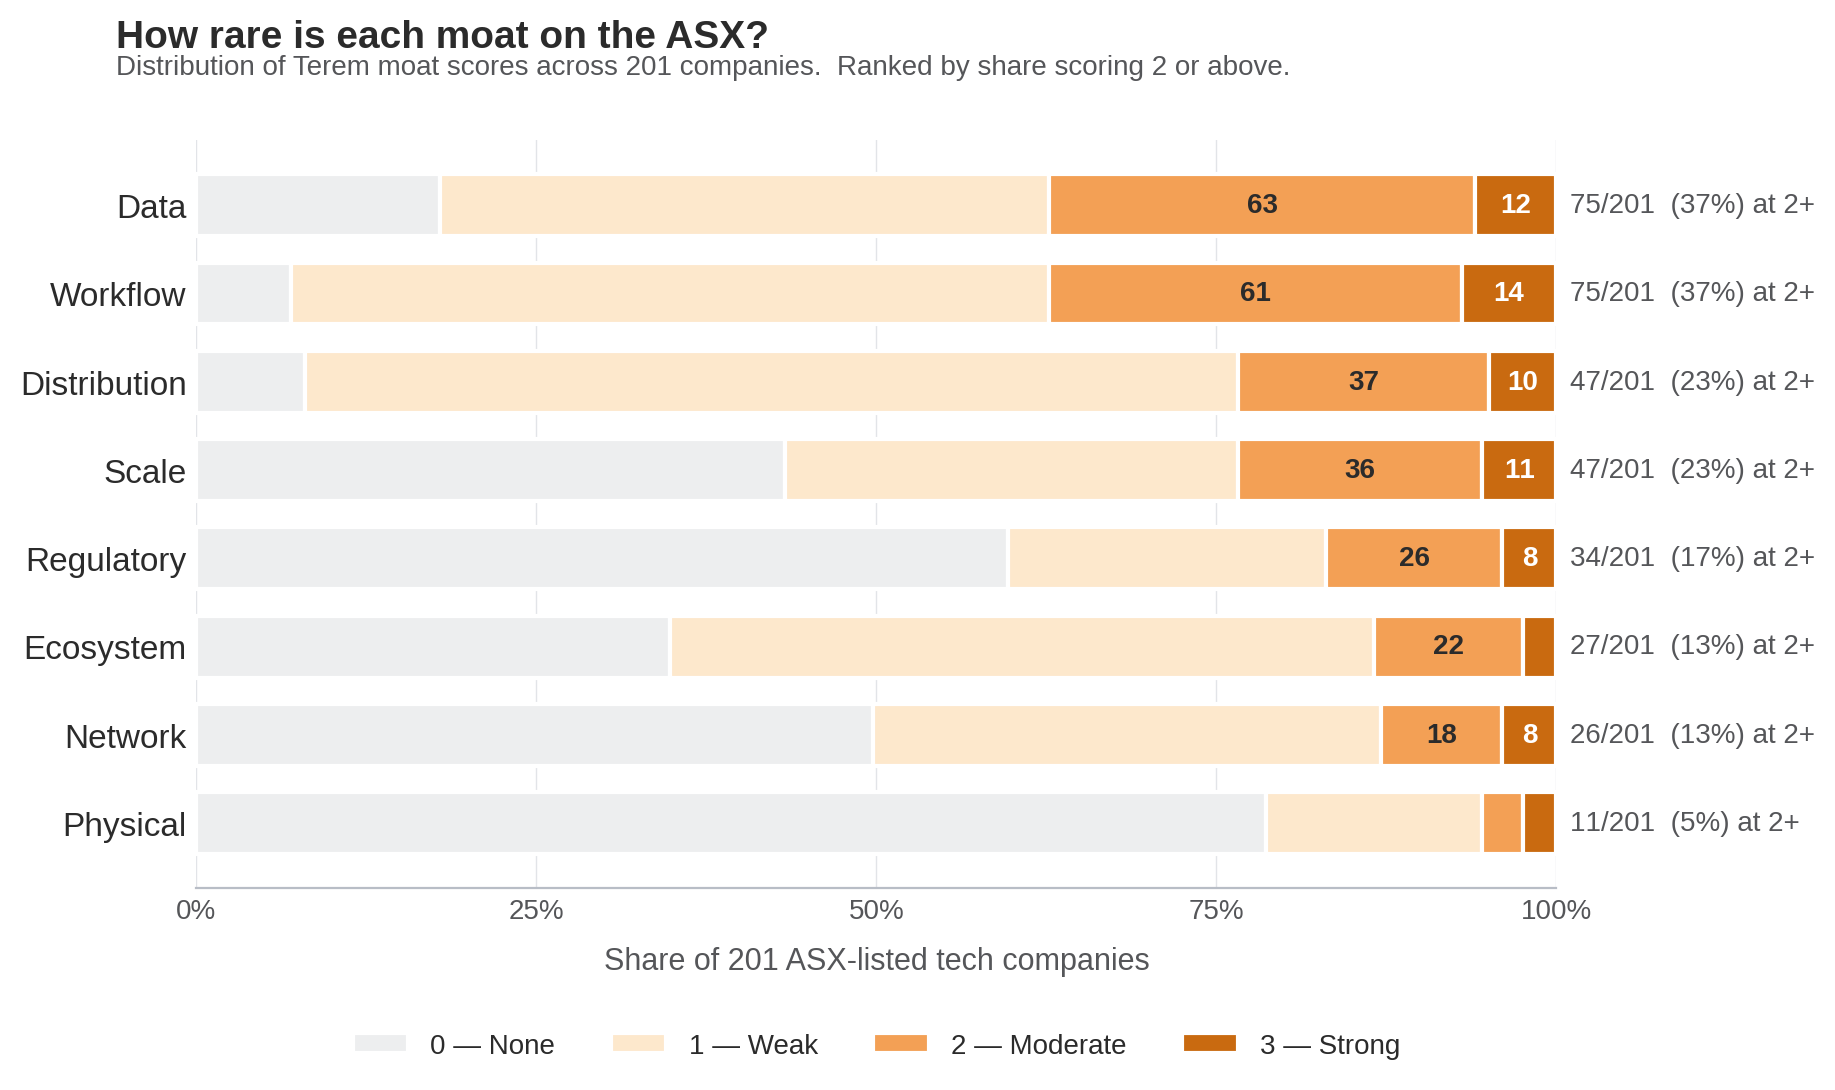
Figure 2: Distribution of Terem moat scores (0–3) across 201 ASX-listed tech companies for each of the eight dimensions.
· Data and workflow are the most common meaningful moats. Both dimensions sit at 75 of 201 companies scoring 2 or above, or about 37%. Almost two thirds of the companies scored didn’t have these as meaningful moats. This is particularly interesting given how important proprietary data is viewed by the tech industry.
· Regulatory, network and ecosystem moats are concentrated. Only 34 companies score 2 or above on regulatory, and those 34 are heavily concentrated in health, government and financial services. Networked platforms are even rarer with 26 companies scoring 2+. Ecosystem moats are rarer still, at 27 companies. If you think of regulation, networks and ecosystems as the structural moats that would hold AI off a vertical, they exist in concentrated pockets rather than across the tech sector more broadly.
· Physical is the rarest moat on the ASX tech index. Just 11 of 201 companies (5.5%) score 2 or above, and five of those are clustered in data centres or regulated hardware (NXT, CDA, MAQ, MP1, DUG). The rest of the index is effectively pure software, which by definition gives AI a clean field to compete on.
The shape of this chart matters for the AI-era question. The two dimensions AI preserves most strongly, physical and regulatory, are also the two rarest. The dimensions most common in ASX tech, workflow and data, sit on opposite sides of the AI substitution line: workflow is under pressure, data is elevated.
Six Durability Archetypes
Having scored every company, a few clusters emerge from the 201 companies. I’ve called the clusters Durability Archetypes, each with a different defensibility logic in an AI world.
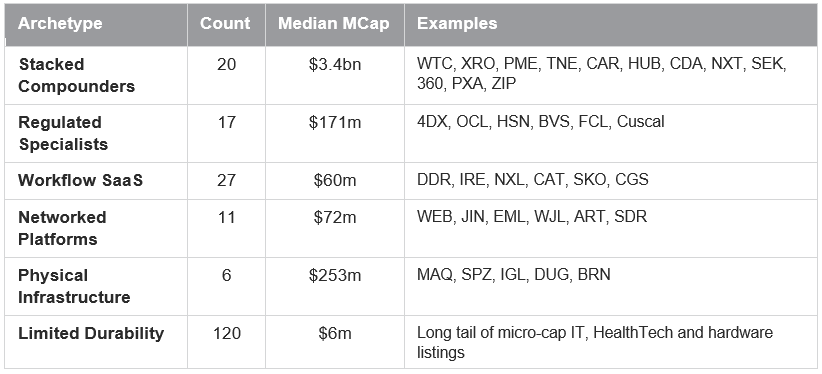
Table 2: Durability Archetypes across 201 ASX-listed tech companies.
1. Stacked Compounders (20 companies, median market cap $3.4bn). Five or more of the eight dimensions scored at 2 or above. This is where the reinforcing-moat pattern lives. The cohort includes the ASX tech flagships like Xero alongside mid-caps like Catapult. The median market cap here is more than 450 times the median of the moat-thin cohort. That gap is the clearest single signal in the dataset.
2. Regulated Specialists (17 companies, median market cap $171m). A regulatory moat at 2 or above, combined with a meaningful data or workflow moat. Clustered in health, financial services, and government. These are the companies where an AI model can’t skip the regulator, even if it could replicate the product.[C2]
3. Workflow SaaS (27 companies, median market cap $60m). The bread-and-butter of ASX software: meaningful workflow embedding plus proprietary data, but without the regulatory, physical or ecosystem layers that move a business into the Stacked Compounder group. This is the archetype most directly exposed to AI substitution pressure on workflows, offset by the data asset. AI could be an opportunity or a value destroyer for them.
4. Networked Platforms (11 companies, median market cap $72m). A network effects moat at 2 or above, without the full Stacked Compounder profile. These are primarily marketplaces and payment networks. These are the companies that might be most exposed to the marketplace-disintermediation thesis, depending on the network without the reinforcing data, regulatory or workflow moats of the larger platforms.
5. Physical Infrastructure (6 companies, median market cap $253m). A physical moat at 2 or above, but not enough other dimensions to land in the Stacked Compounders. These businesses own infrastructure or hardware that AI can’t replicate.[C3]
6. Limited Durability (120 companies, median market cap $6m). The long tail mostly has no moat scoring above 2, with a few exceptions, as well as a relatively weak data or workflow moat. Mostly micro-cap software and, surprisingly, health. These are the companies most exposed to AI substitution and least able to resist it.
The Moat Barbell Curve
The ASX tech sector looks more like a barbell rather than gentle continuum. Eighty companies, or 40% of the index, have zero dimensions scored at 2 or above. Twenty have five or more and the middle is thin.
You can see this in the chart below, Figure 3. The left panel is how many companies sit in each moat score bucket. The right panel is the median market cap of each moat score bucket.
Figure 3: Left: count of companies by number of moats scored 2 or above. Right: median market cap per bucket on a log scale.
More moats comes with step changes in market cap rather than linear increases. The median market cap climbs gently from $7m at zero moats to $67m at two moats to $100m at three moats. Then it jumps an order of magnitude to $365m at four, and another order of magnitude to $3.5bn at six or more. The market rewards stacked moats.
It’s worth acknowledging that bigger companies have had more time to build moats, and scale itself buys some of the inputs that score as moats. It’s hard to untangle causation (did the moat come first or the did the size enable the moat?). But the stacking pattern is still useful because it tells us where the durable businesses sit, and it shows how few of them there might be.
Key Insights the 8 AI Moats Give for ASX Tech
Four observations fall out of the scoring:
1. ASX tech is a moat barbell. Twenty Stacked Compounders sit on top of a 120-company long tail with no meaningful moat. The companies with a small number of strong moats in the middle is sparsely populated. For investors this is an expectations-setting exercise. The tech sector seems to be a “small number of strong durability companies with a long tail facing existential challenges” rather than “two hundred tech companies with moderate moats.”
2. Workflow and data are the most common moats. They’re the two most common dimensions at 2+ (both at 75 companies), and they’re the two dimensions where you most often see a 3 (14 companies at data, 12 at workflow). Most of the other moats (i.e. regulatory, network, physical, ecosystem) might be structural features of the vertical the company is in or come about as the company has scaled over-time.
3. Physical is rare: the physical moat, the one most difficult for the latest wave of AI technology to challenge, is also the rarest.
4. AI could propel most companies or destroy them. If all you have is a workflow moat then you also have an opportunity with AI. You have customers you can ship more to, faster. You have customers you can improve workflows for immediately. “AI-native” competitors have catching up to do while you have the opportunity to win. But, if you don’t move and don’t move quickly it’s significantly more likely that you’ll lose customers (relative to 2 years ago).
5. How we build durability may have changed (or be completely the same). Xero didn’t start with a stack of moats. They started with a workflow that they’ve used to build moats in the other areas. This might be harder to do now as companies will need another moat to succeed in the face of AI. Then again, it’s always been the case that extra moats help so perhaps nothing has changed, we’re just being more sharply reminded of business fundamentals again.
Next in the Series
The next article takes the moat scorecard from this article and puts it alongside the market’s verdict from the February 2026 SaaSpocalypse. The early analysis I’ve done has some interesting insights into where investor sentiment aligns with and diverges from a considered view of durability.