
ASX Software Investors Priced AI Risk, Not Performance
Analysis of 180 ASX-tech companies shows sentiment accounts for 99.9% of the decline in valuations

Since February 2026, ASX tech stocks have experienced the sharpest sentiment-driven selloff since the pandemic, triggered by the view that AI is coming for software.
The “SaaSpocalypse”, as it is known, has wiped billions in shareholder value across the globe.
But what’s really going on here?
I analysed the financials, share price and AI durability of every ASX-listed tech company to find out.
This first article shows that one-year revenue growth explains just 0.1% of three-month price movements.
Companies growing revenue at 20% were hit harder than companies whose revenue was declining. The SaaSpocalypse was overwhelmingly a sentiment event, not a fundamentals event.
Recent Performance Didn’t Cause the Selloff
The most important finding in our dataset is this: the relationship between revenue growth and share price performance during the selloff is essentially zero. We regressed three-month price changes against one-year revenue growth for 180 companies with available data. The result: R² = 0.001. Revenue growth explains 0.1% of the variance in returns.
Key Finding: R² = 0.001. Revenue growth explains just 0.1% of the February 2026 tech selloff. The other 99.9% was sentiment.

Figure 1: Each dot is an ASX tech company. The near-flat regression line shows revenue growth had virtually no predictive power over the selloff.
This means the market was not responding to business deterioration. Companies growing revenue at 20% per year were punished just as severely as companies with declining revenue. The selloff was a wholesale repricing of AI existential risk across the sector.
The Growth Hump of Pain
The pattern becomes even more counterintuitive when we group companies by revenue growth rate. Companies growing 10-30% were hit hardest, averaging -26.5% over three months. Companies with declining revenue fared better (-14.3%). Even companies growing above 30% averaged -20.0%.
The worst place to be in the SaaSpocalypse was growing 10-30 percent. Not struggling. Growing.

Figure 2: Average three-month returns by revenue growth bucket. The 10–30% growth cohort was punished most severely.
Table 1: SaaSpocalypse Impact by Revenue Growth Rate
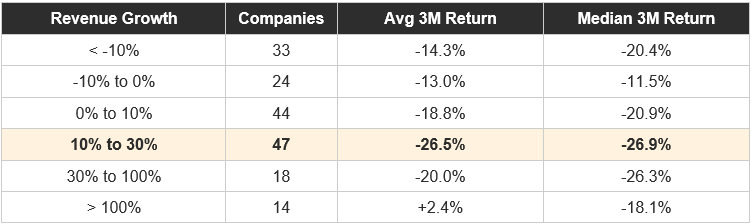
Source: Koyfin, Terem Capital analysis. 180 ASX-listed tech companies.
The explanation is straightforward: companies growing 10-30% carry high valuation multiples (the market was paying for their growth) but sit squarely in the AI substitution zone. These are the mid-cap SaaS companies, like Megaport (-42.6%), Zip (-47.7%), ReadyTech (-54.4%), SiteMinder (-52.8%), where the market is asking: can an AI agent do what this software does?
Declining companies had already been de-rated. Hyper-growth companies (>100%) were either so early-stage that AI risk felt abstract, or in hardware and HealthTech subsectors where AI is a tailwind rather than a threat. It was the middle of the growth curve that absorbed maximum pain.
The Market’s AI Fear Rankings
To isolate pure AI sentiment from fundamental performance, we computed a sentiment residual for each company: the gap between its actual three-month return and the return predicted by its revenue growth. Aggregating these residuals by subsector reveals the market’s implicit ranking of AI vulnerability.

Figure 3: Average sentiment residual by subsector. Negative values indicate the subsector was sold off beyond what its revenue performance justified.
EdTech stands out as the subsector the market fears most from AI, averaging -25.6% beyond what revenue justified. AI tutoring and content generation directly threatens every EdTech business model. Cybersecurity (-14.5%) and Data Centres (-13.0%) follow. The Data Centre result is notable: despite 21.2% average revenue growth, the market applied a significant AI fear premium, perhaps questioning whether ASX-listed operators will capture the AI compute boom or be bypassed by hyperscalers.
On the resilient side, IoT/Hardware (+10.7%) and HealthTech (+9.1%) earned a resilience premium. The market is implicitly saying: companies with physical products or regulated medical data are harder for AI to displace.
Key Finding: The market’s implicit AI vulnerability ranking: EdTech > Cybersecurity > Data Centres > IT Services > Fintech (most feared) through to IoT/Hardware and HealthTech (most resilient).
Four Quadrants of AI Sentiment
Plotting three-month returns against three-year returns for 174 companies with both data points reveals four distinct cohorts:

Figure 4: 174 ASX tech companies mapped by three-year and three-month price performance. Bubble size proportional to market cap.
Q1: Selloff Victims (42 companies)
Long-term winners hit by the selloff. 26 of these 42 are also growing revenue above 10%. These are the purest AI sentiment victims. Names include Pro Medicus (-43.3% 3M, +31.9% revenue), Zip (-47.7% 3M, +23.5% revenue), Life360 (-38.6% 3M, +31.8% revenue), and Megaport (-42.6% 3M, +16.3% revenue).
Q2: Double Trouble (82 companies)
Down over both periods. The surprise inclusion is WiseTech (-41.4% 3M, -41.4% 3Y) at $9.0 billion. SEEK (-38.7%), Xero (-30.6%), and SiteMinder (-52.8%) also fall here.
Q3: AI-Proof Winners (16 companies)
Positive over both periods: Technology One (+1.3% 3M, +87.1% 3Y), Codan (+10.0% 3M, +488.6% 3Y), NEXTDC (-0.7% 3M, +15.9% 3Y), 4DMedical (+21.5% 3M, +955.6% 3Y). Disproportionately in IoT/Hardware, HealthTech, and deeply vertical B2B SaaS. Their average regulatory moat score (1.0) is notably higher than the sector average (0.6).
Q4: Turnaround Candidates (15 companies)
Down over three years but stable or recovering recently. The most notable is Appen ($267M), which rose 65% in three months after declining 43% over three years. The market may be reassessing its AI training data business.
AI Sentiment or Just Overpricing
Social media will tell you that the repricing was about how AI is going to eat software.
Sentiment can be hard to pin down. However, there could be something else at play.
Much of ASX SaaS was overvalued long before “AI.” Years of near-zero rates inflated multiples that revenue growth could never justify. AI gave the market a narrative that made the repricing feel rational rather than embarrassing. Investors get to save face with an “unforeseeable” change in the market. The selloff was real; the question is how much of it was AI-specific fear and how much was gravity finally reasserting itself on valuations that had drifted free of fundamentals.
The next article in this series tests that question. We scored every ASX tech company on eight dimensions of AI durability and correlated them with selloff performance. The results challenge conventional wisdom about what makes a tech company defensible.
Methodology and Data Notes
All figures in AUD millions unless stated. Price changes reflect market data. EV/EBITDA and EV/Sales are last-twelve-months figures. The sentiment residual is calculated as actual three-month return minus the return predicted by a linear regression of three-month returns on one-year revenue growth (R² = 0.001, slope = 0.003, intercept = -0.179). Quadrant analysis uses thresholds of 0% for three-year returns and -10% for three-month returns.