Metrics for evaluating ASX Tech: Part 3/5 - Unit Economics 🔍
How we evaluate it for ASX technology companies, and misunderstandings on gross margins and LTV to CAC ratios
Welcome to Part #3 of the series on Metrics for Evaluating ASX tech.
You can find Part #2 on Growth here
Subscribe so you don’t miss further insights on ASX tech
#3.Unit Economics: where investors go wrong and how we dig in ⛏
Unit economics describe how a company makes money from each unit of output.
Sounds simple. But with no disclosure requirements and limited consistency in what’s reported - its often hard to figure out what’s actually going on under the hood.
Unit economics differ between transactional versus recurring revenue businesses.
Transaction-based businesses: start with price, gross and contribution margins, and repeat sales
Recurring revenue businesses: value is recognized over the customer lifetime, so the focus is on Annual Contract Value (ACV), Customer Acquisition Costs (CAC), Payback periods and Lifetime Value (LTV)
Many of these metrics are well covered elsewhere, but two areas we see misunderstood by investors and show wide disparity in ASX technology companies are gross margins and LTV.
i. When Gross Margins make revenue multiples impractical
It’s easy to compare revenue multiples - but comparing them without reference to underlying gross margins is misleading.
Gross margins give us a view on the variable costs to activate and maintain a customer, which is critical in assessing the value from $1 of revenue.
In general:
Higher gross margin businesses: low touch onboarding like triggering a welcome email, adding a row to the database and the new customer can be successful
Lower gross margin businesses: require high touch like paying third party providers, spinning up new infrastructure, installing hardware, and paying people for implementations
When looking at the Mopoke Cloud Index, gross margins have a significant spread from <20% for tech enabled service providers, all the way up to >90% for low-touch, self-serve technologies like Ansarada and Pointerra.
That means each $1 of new revenue from these higher gross margin companies is >3x more valuable than their lower gross margin peers.
Gross margins above 80% are very healthy and have a strong correlation with long term profitability and valuations.
So what’s the point? Not all revenue is equal.
While revenue multiples can be a helpful shortcut in assessing relative valuation - you need to know its limits and the delivery cost of the revenue, and thereby the comparative value when comparing across companies.
ii. How LTV highlights value creation (when you can find it)
LTV is an estimate of the gross profit that an individual customer will generate over the lifetime of their relationship with the company.
Understanding LTV by itself can be a good start. It says a lot about how a product or service is priced, how much value customers get from the product, and how long customers stick around.
Understanding LTV in context with CAC can be magic. It allows you to compare how valuable a customer is in context of how much is spent to acquire them, and can provide significant signal on value creation.
Good recurring revenue businesses have a ratio higher than 3x
Most successful large public SaaS companies have ratios close to 4x - 5x
If >5x, companies could be growing faster by investing more in sales and marketing
Metrics like these are not required to be published by ASX listed companies, so disclosure is at the discretion of the board and management team.
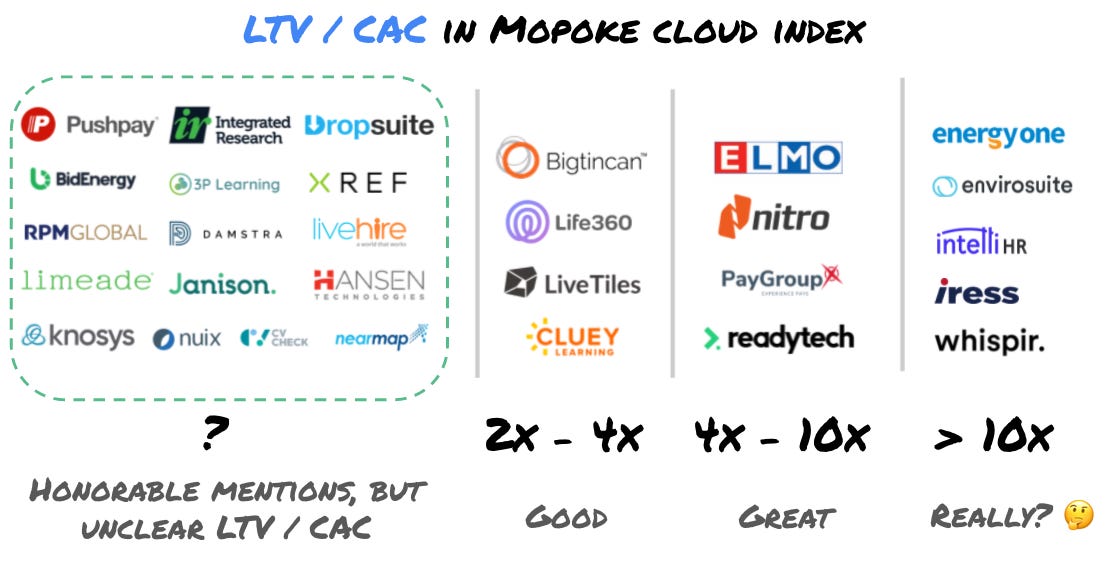
Across the Mopoke Cloud Index, companies fall into three disclosure buckets for their unit economics:
Limited: some numbers, but hard to figure out what’s really going on at the unit level
Honorable mentions: some numbers and signal (i.e. pricing, margin and customer counts)
Transparent: most numbers and clear signal 👏👏👏
Only 16% of subscription-based companies fall into the ‘Transparent’ bucket, which can then be segmented by tier.
Why are we questioning >10x LTV / CACs?
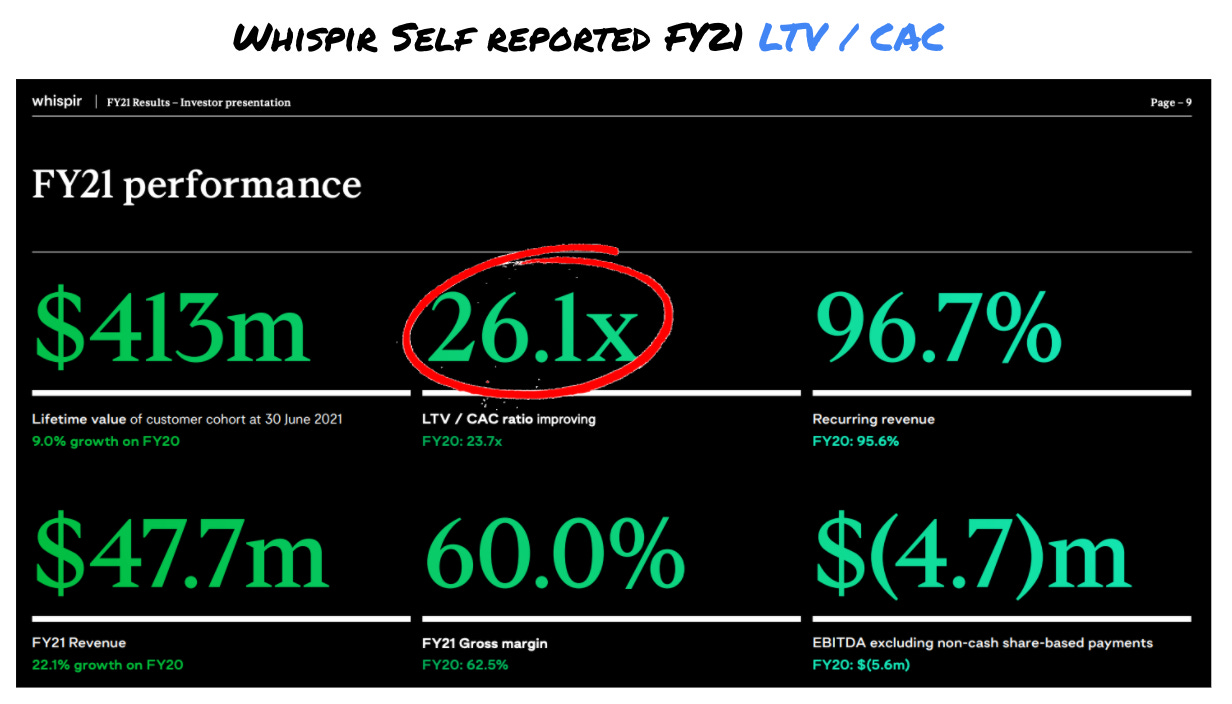
To pick on Whispir, they spent $1.6m on advertising and marketing in Q1 FY22 to acquire 33 new customers, implying a CAC of $50k. The average customer pays $70k, which at a 60% margin gives $41k a year of gross margin.
Whispir’s self-reported LTV/ CAC is 26.1x, implying each of those customers should have an average LTV of $1.3m (or 32x gross margin).
Whispir is a good company with a loved product, growing in a big market, and this is just one quarter…. but 26.1x sounds high and likely assumes very long tenures and significant expansion revenue 🤔 .
How we dig into a company’s unit economics?
We wouldn’t invest in a company if we didn’t understand the unit economics.
If we don’t know the inputs on how the business creates value, we can’t take a view on how these inputs will evolve over time?
When digging into a company’s unit economics, we go through:
Disclosures: some companies don’t publish these numbers for a good reason (i.e. competitive dynamics). That’s fine, but means we need to make educated guesses. Companies changing disclosure levels (i.e. removing key numbers) is a flag we watch out for
Confidence: when numbers are reported, they still need diligence (see >10x LTV/ CACs above). Accounting classifications and management views naturally bring bias, such as what’s recognized in COGS vs Opex
Components: there are different inputs for different businesses. Break down each input as much as possible paying attention to what’s controllable vs not-controllable by the company
Importance: test different assumptions to identify what really matters
For some worked examples, check out our deep dives on:
🚐 Camplify: 25% take rate & 15% contribution margins
💵. PayGroup: 5x LTV to CAC, with improving margins
Thanks for reading. What’s next?
In Part #4, we’re going to cover Growth Efficiency: Why we ❤️ Life360’s cash burn. Subscribe here so you don’t miss it.
We’d also love your feedback so that the newsletter can continue to grow and improve. If you have a question or data set you’re interested in ASX tech - ask us here or email andy@andycrebar.com


