
Small B2B SaaS on the ASX Doesn't Get a Software Premium Anymore
Some ASX tech subsectors held up, but AI sell-off just accelerated a downward trend for SaaS and Cyber

Small technology companies with limited moats are normal companies now.
The software-as-a-category premium is gone. Valuation multiples for most smaller ASX-listed technology companies are down to ~1x revenue.
This trend has been underway for the last 3 years. While bigger companies were indiscriminately sold off, the AI-driven sell-off in February 2026 was just an acceleration of the downward valuation trend for small caps.
Gone are the days of smaller tech companies, with lower growth and limited profits, being able to justify eye-watering multiples and valuations just because they have software on the label.
That being said, software can be a proxy for favourable economic properties (like recurring revenue), but AI means more durable moat profiles are needed by small-caps to thrive and command higher valuations (like Part 4 in this series showed).
This article is Part 5 in the series on AI and its impact on ASX tech companies. For this article, we are looking at companies with limited moats (as per the AI Moats Framework) that declined in price during SaaSpocalypse. These are mostly small and micro-cap tech companies.
We will cover:
Sold Off, Small Cap Cohort Metrics
New Multiples for Small Tech Companies
B2B SaaS Multiple Decline: AI Risk or Performance?
Valuations and Microcaps
Sold Off, Small Cap Cohort Metrics
The cohort of ASX-listed companies we’re looking closely at in this article are technology companies that declined in valuation and have limited moats against AI.
The moats for durability in the age of AI are: data, workflow, regulatory, distribution, ecosystem, network, physical, and scale. We scored each company against each. Part 2 of this series provides a more detailed overview of the AI Moats framework and explains how it was applied to the entire ASX tech universe.
This moat filter ended up selecting, understandably, for smaller companies as smaller companies tend to have a lower count of moats and for the moats they do have, weaker moats than their larger peers.
There are 51 ASX tech companies with limited moats and a decline in share price. This represents 25% of the 201-company universe by count and just 2.7% by market cap.
Here is a four-panel chart showing (a) companies by size, (b) revenue multiples, (c) distribution of the 3-month return profile across the cohort, and (d) market cap versus EBITDA.
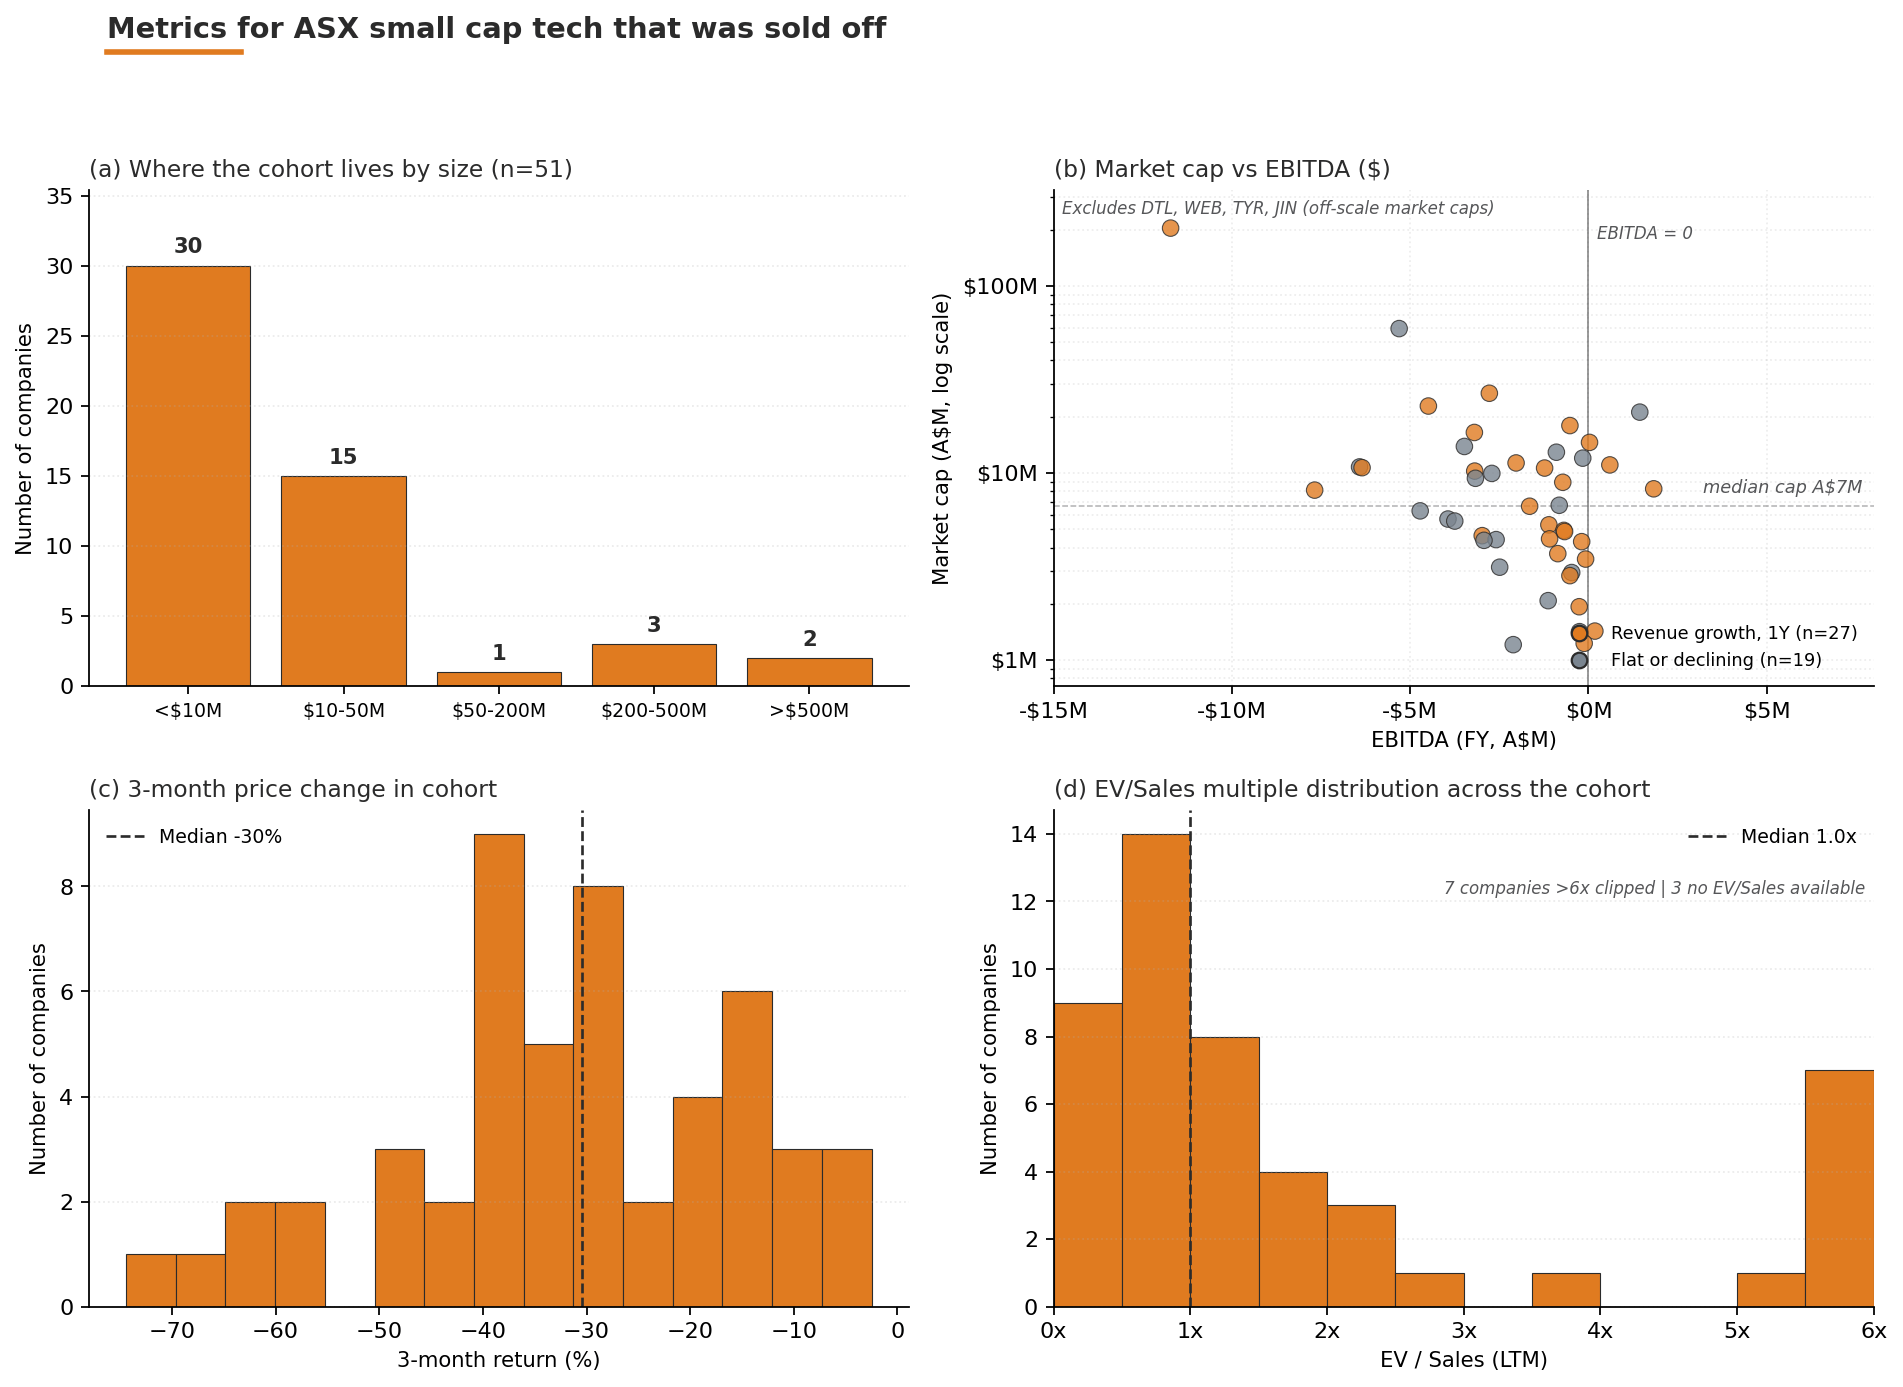
Figure 1. Cohort overview — size, valuation distribution, recent return, and EBITDA-positive share by moat tier.
Four things stand out in the snapshot:
Mostly micro-caps: 30 of 51 are sub-$10M market cap. 45 of 51 are sub-$50M. A few larger companies (DTL, WEB, TYR and JIN) snuck through our filter so they are excluded in some charts.
Multiples are mostly under 2x revenue: Except for a few outliers, multiples for this cohort mostly fall below 2x with just under or around 1x being the largest group.
The 3-month drawdown was severe: The median decline in share price over 3 months was -30%. The mode of the distribution sits between -20% and -40%, which is a heavier tail than the broader sector saw.
Profitability is not common: Most of these companies are not profitable and many have flat or declining revenue.
New Multiple for Small Tech Companies
So, what does this all mean for multiples for small technology companies?
This question matters for investors so they know how comparable companies are being valued. It matters for business leaders so they know what game they are playing and what metrics to optimise for.
The spread of multiples by subsector in this cohort looks like this:
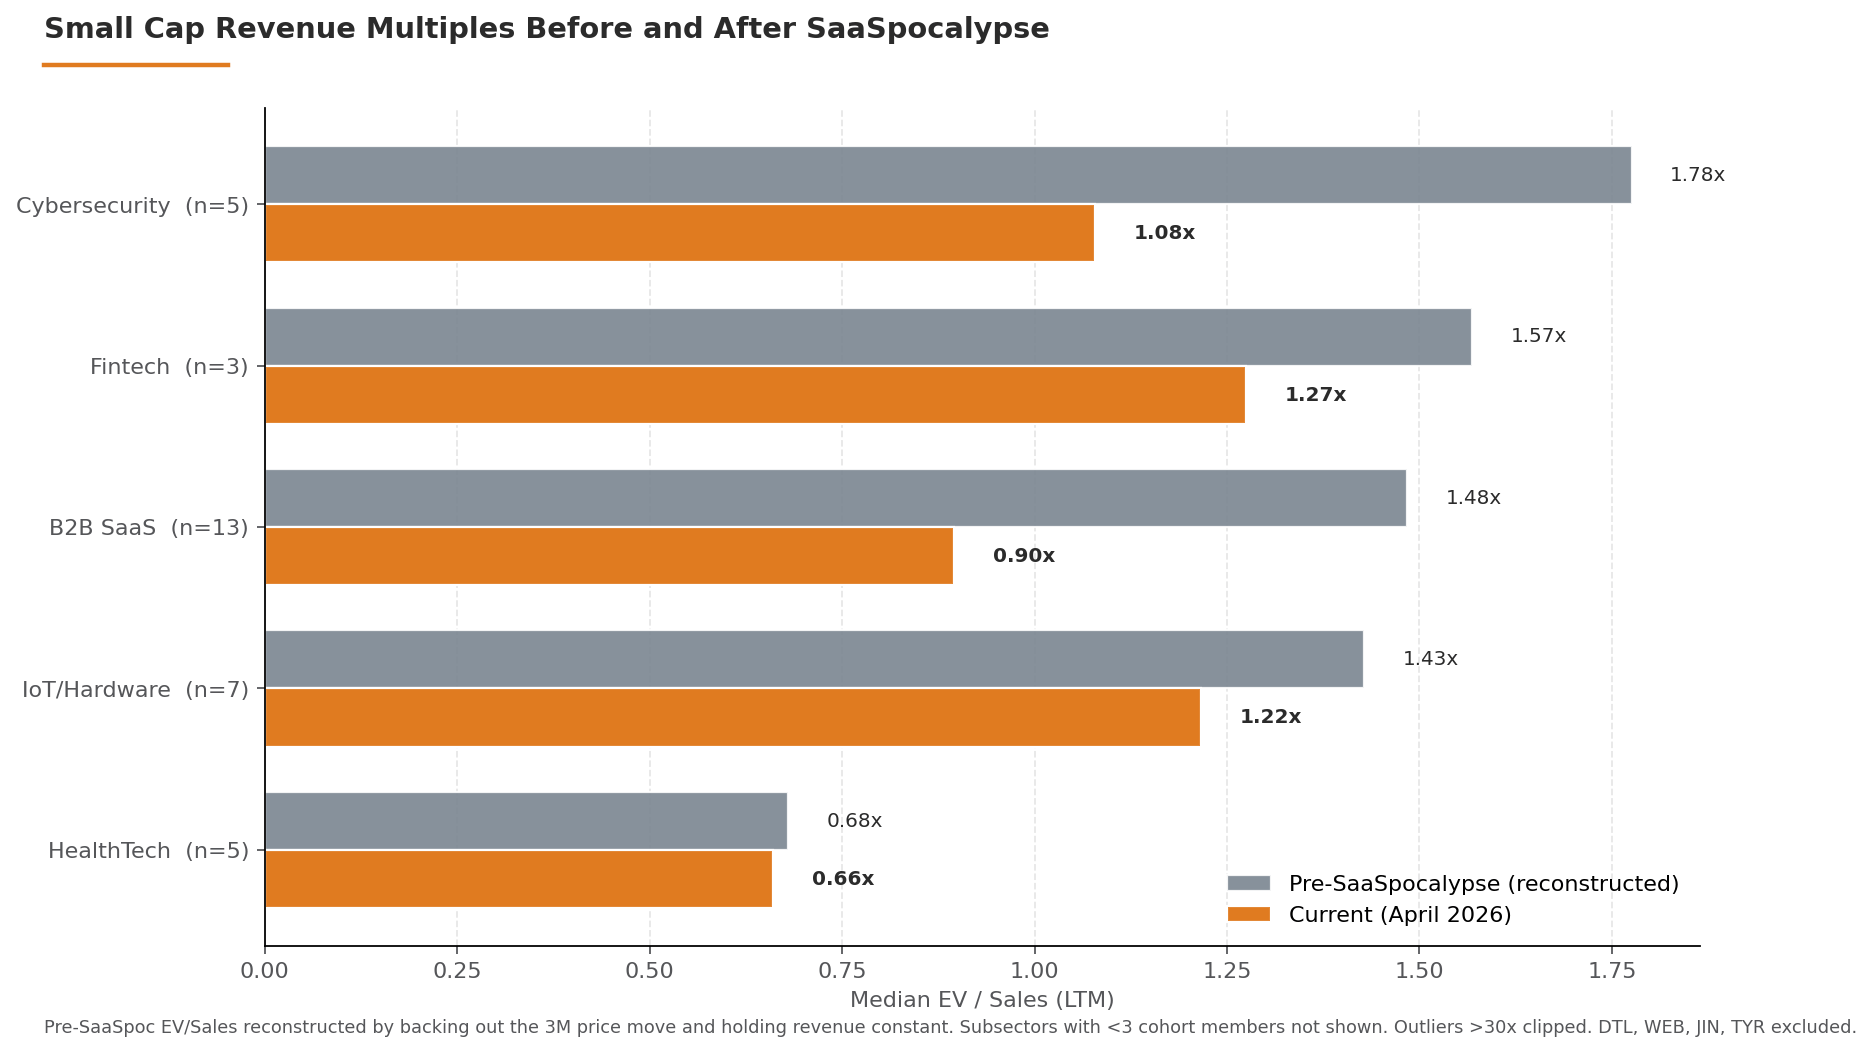
Figure 2. Median EV/Sales pre-SaaSpocalypse vs current, by subsector (cohort only). Pre-SaaSpoc value reconstructed by backing out the 3-month price move.
The decline in valuation multiple is strongest where the AI substitution thesis has a good case:
B2B SaaS multiples are down -40% (1.48x → 0.90x). This is the largest single subsector group in the cohort (n=13), and it is now priced below 1x revenue.
Cybersecurity multiples are down -39% (1.78x → 1.08x). Five micro-cap names that are facing into the immense challenge and opportunity AI brings to the cyber sector.
HealthTech multiples in the cohort barely moved (-3%). There are likely two parts to HealthTech in this cohort holding constant through the sell-off. Firstly, the HealthTech companies in this cohort were already priced relatively low. Secondly, the prior article showed HealthTech companies to be a profile for durability. The HealthTech companies in this cohort are likely looking for further regulatory approval or more data to get better valuations.
IoT/Hardware multiples down -15%. This is down half as far as B2B SaaS and Cyber, which seems to line up with first principles thinking that physical moats (hardware) offers more protection than workflow and data now.
Overall, B2B SaaS and Cyber have been re/devalued the furthest, with multiples sliding down by 40%. Intuitively, this fits the general consensus on where AI vulnerability is.
This relative decline in multiples for B2B SaaS and Cyber is even more pronounced when we include companies from the small cap cohort with limited moats but whose valuation went up:
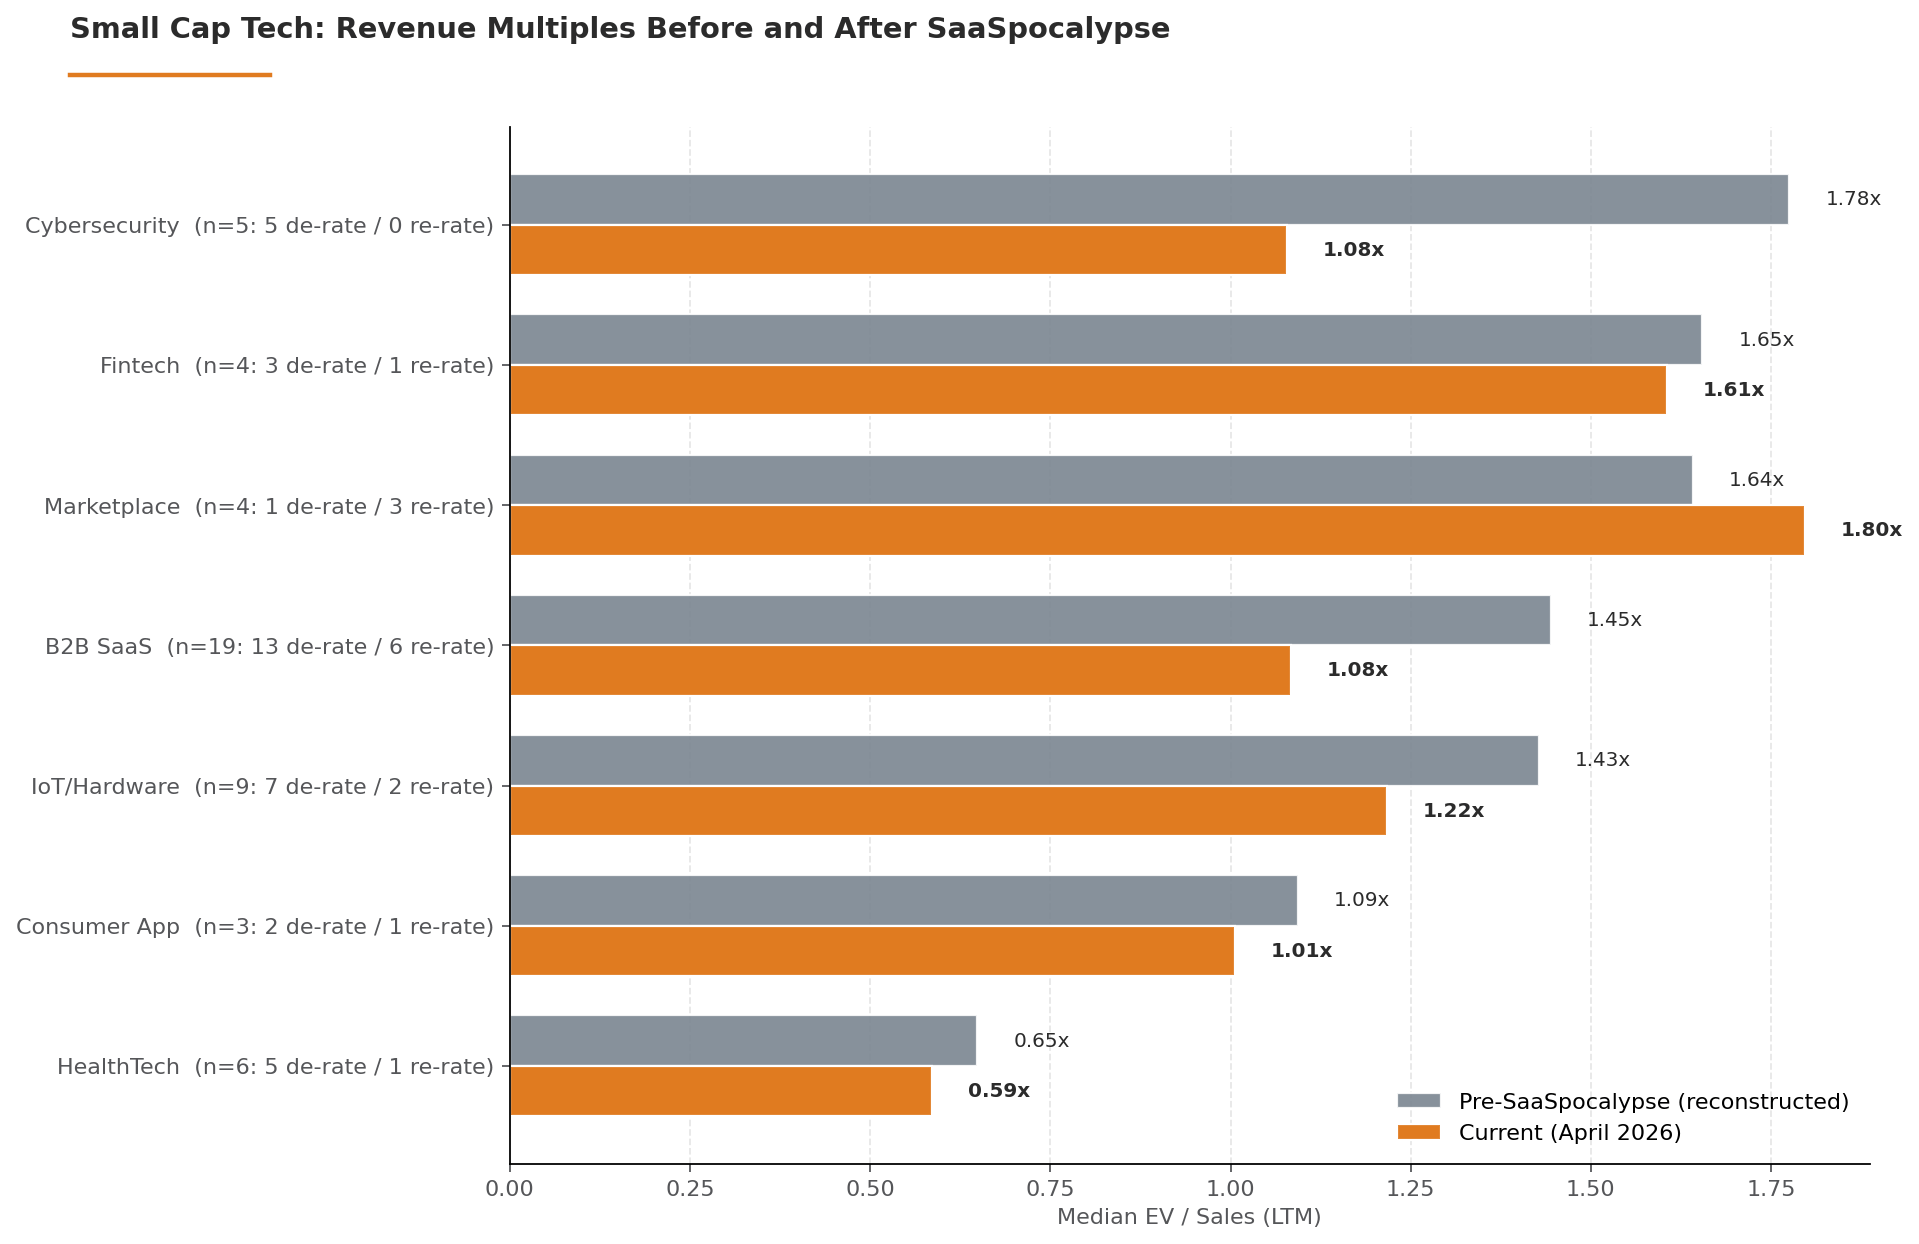
B2B SaaS and Cyber are really the only categories where there was a material change.
B2B SaaS Multiple Decline: AI Risk or Performance?
To understand what is behind the change in multiple for B2B SaaS, we need to try to separate performance from perceived AI risk and the sell-off.
The chart below shows the change in share price by revenue (last 12 months), revenue growth (over 1 year), EBITDA (%), and the number of stronger moats:
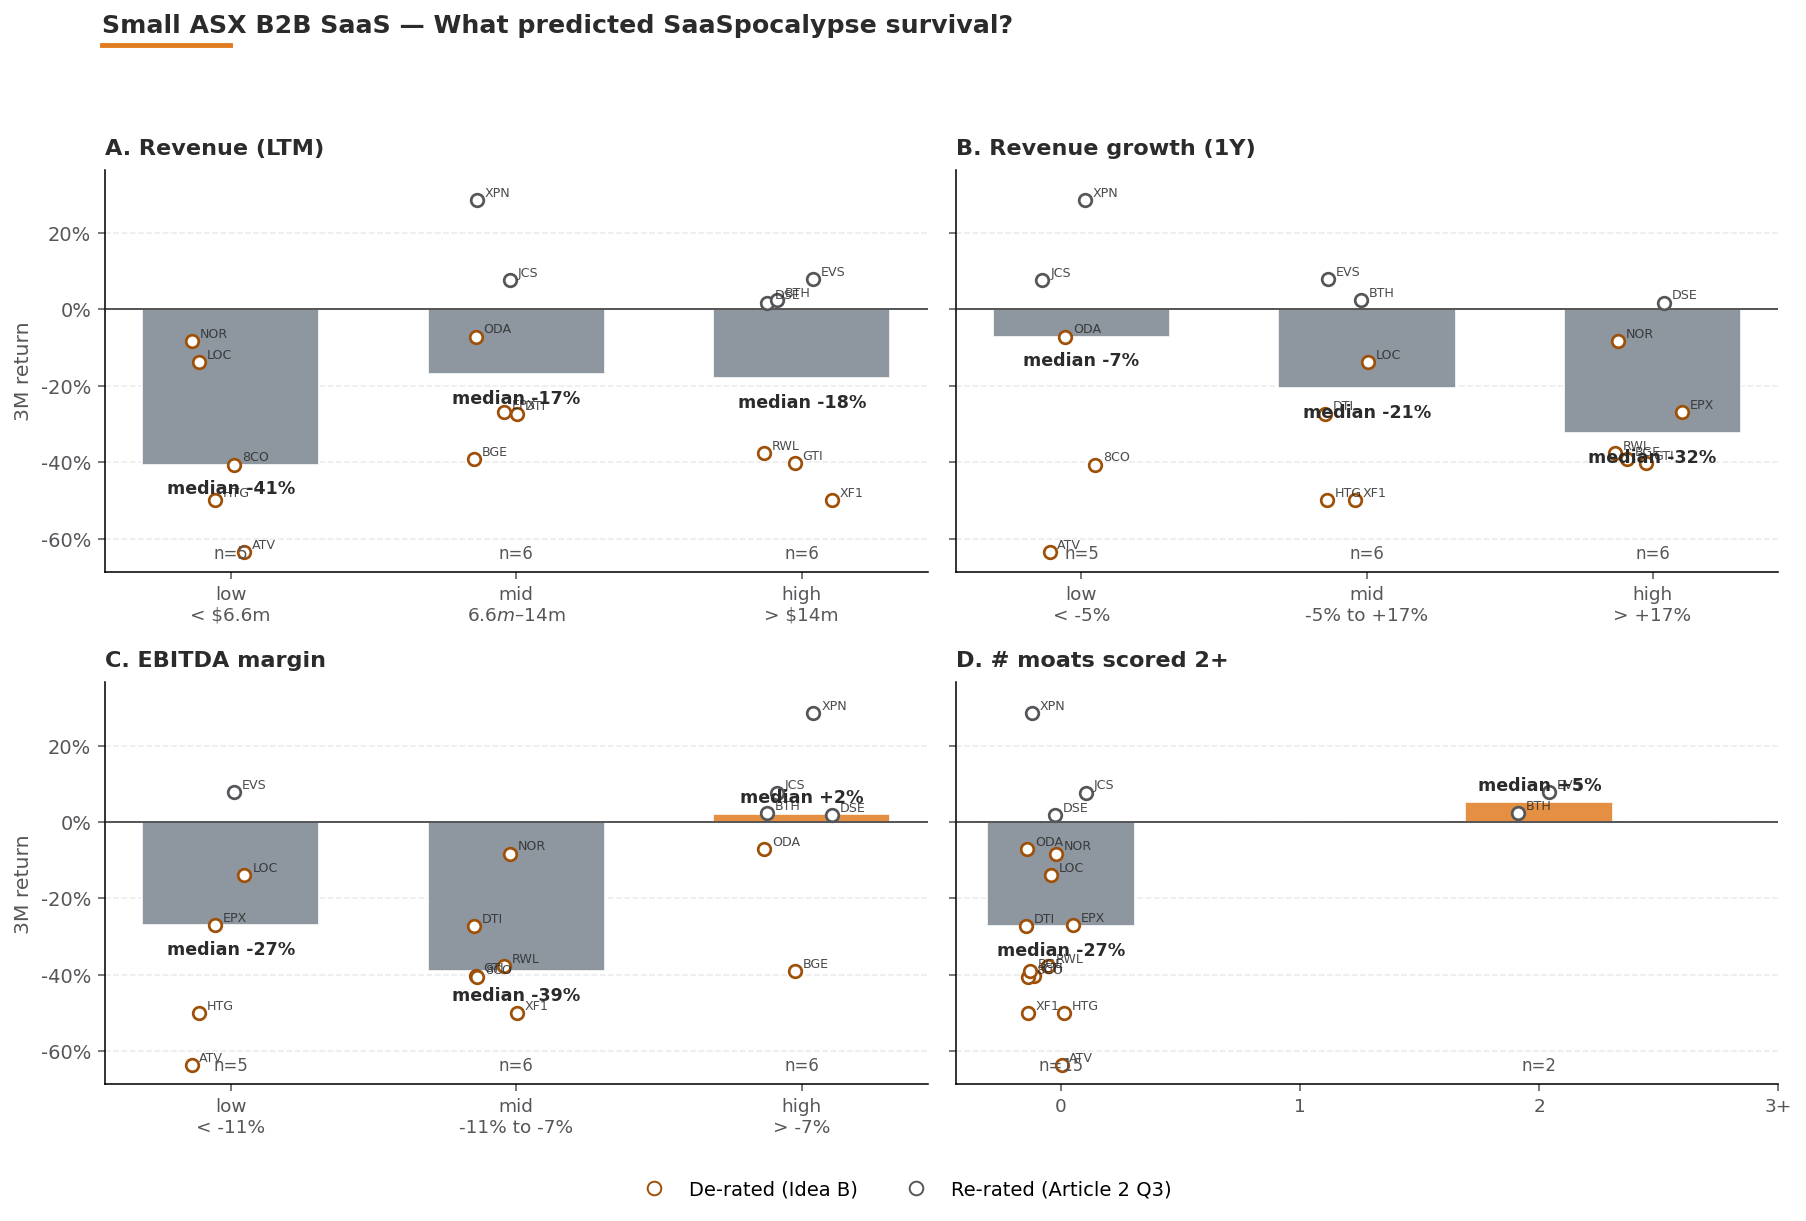
The next chart shows revenue multiples (EV/Sales) along the same performance measures:
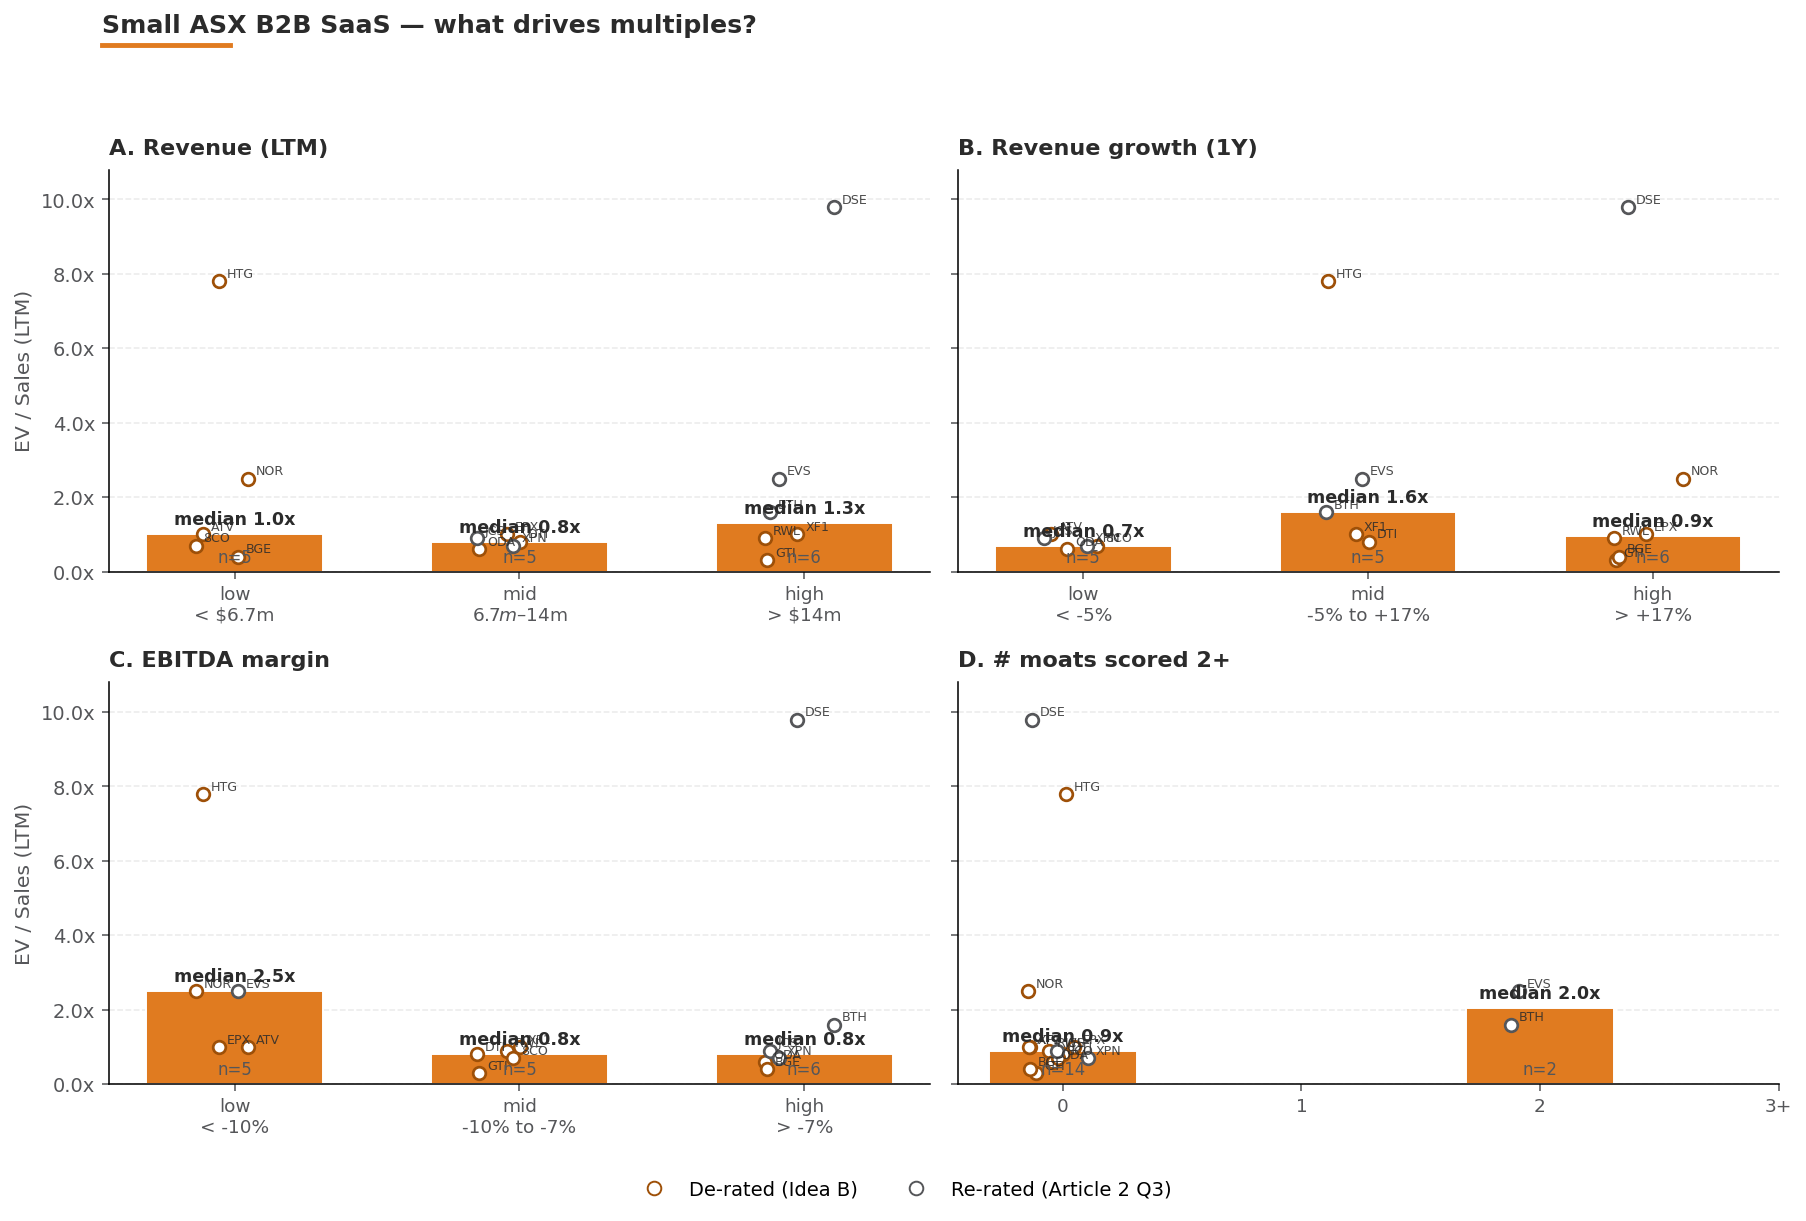
From these two charts we can see:
Moats matter: at this end of the market, companies that have more, stronger moats got a higher valuation. The sample size is small, and this cohort is already filtered for less moats, but it does make those with multiple, strong moats stand out, which fits with the power law.
Profitability protected: profitable SaaS companies were mostly able to withstand SaaSpocalypse.
Goldilocks revenue growth: Just enough revenue growth helped, but too much and it hurt. This counterintuitive finding of faster-growing companies being hurt the hardest by SaaSpocalypse shone through in the broader data set covered in Part 1 as well.
More revenue is better: A higher quantum of revenue is valued more.
Valuations and Microcaps
The insights into microcaps and their valuations needs to be considered alongside a few structural considerations for a public company of this small scale. Many have limited trading volume, limited history, and are tied to specific events propelling them forward.
Of the 51 companies in this cohort, most are:
making losses (42 of 51 or 82%)
on limited revenue (26 or 51% have less than $10m revenue),
with limited cash at bank (15 or 29% have under 24 months cash runway
The market is considering survival and the need for future cash raises as much as future potential. In some ways this is no different to a private small tech company. So this gives an interesting view into broader market multiples for smaller software companies.